Constructing and Comparing Linear and Exponential Models
Joe and Jill each do chores around the house. They each get paid twice a month. Joe starts out with getting paid $5 every two weeks with a growth rate of 50% each time she is paid. Jill starts out with getting paid $10 every two weeks with a growth rate of $2 each time he is paid.
In linear model there is a constant rate of change of $2 in salary whereas, in exponential model there is a constant percentage change of 50% in Joe's salary.
In linear model there is a constant rate of change of $2 in salary whereas, in exponential model there is a constant percentage change of 50% in Joe's salary.
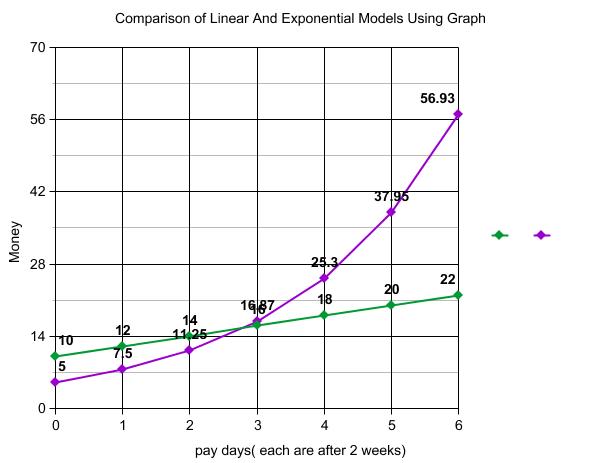
As you can see in the chart below, Jill starts out with more money but after 6 weeks which is the third pay day, Joe surpasses his and has more money and gets paid more. If you needed to make more money in 4 weeks or less, you would want to pick Jill's salary because he makes more money in a short period of time. If you were going to work for 6 weeks or longer, you would want to have Joe's salary because he makes more money after 6 weeks.
In the exponential model, 1.50 represents the constant growth rate each time he is paid and 5 represents the initial amount when Joe started. In the linear model, 2 represents the amount of money added each time she is paid and 10 represents the amount of money Jill started with.
In the exponential model, 1.50 represents the constant growth rate each time he is paid and 5 represents the initial amount when Joe started. In the linear model, 2 represents the amount of money added each time she is paid and 10 represents the amount of money Jill started with.
|
Number of Weeks
0
1 2 3 4 5 6 |
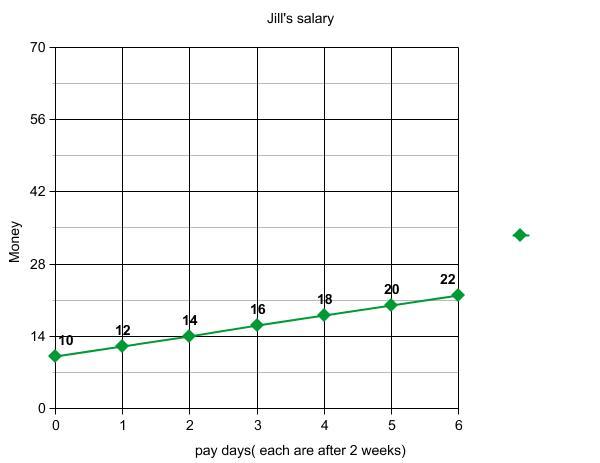
Jill's Salary(Linear Model)
$10
$12 $14 $16 $18 $20 $22 |
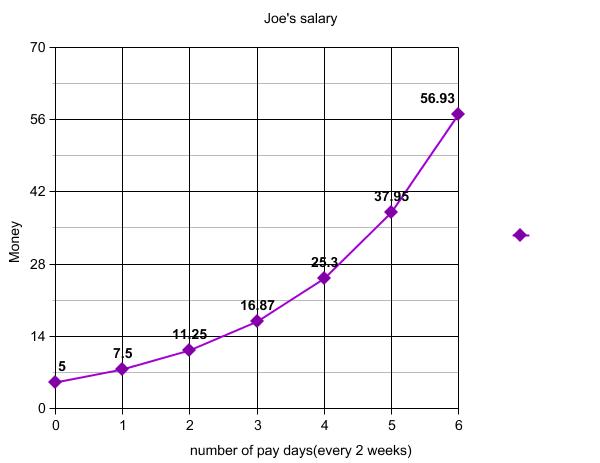
Joe's Salary(Exponential Model)
$5
$7.50 $11.25 $16.87 $25.30 $37.95 $56.93 |
To see graphs of Jill's and Joe's salary
http://nces.ed.gov/nceskids/createagraph/default.aspx?ID=751d50c286a049878bf242060eff249b
http://nces.ed.gov/nceskids/createagraph/default.aspx?ID=1242b05c4d7d404b82b2693fcc794f38
http://nces.ed.gov/nceskids/createagraph/default.aspx?ID=751d50c286a049878bf242060eff249b
http://nces.ed.gov/nceskids/createagraph/default.aspx?ID=1242b05c4d7d404b82b2693fcc794f38
Comparison Of Linear And Exponential Models Using Graph:
The green line shows the linear model for Jill's salary whereas, the purple line shows the exponential model for Joe's salary.
The green line shows the linear model for Jill's salary whereas, the purple line shows the exponential model for Joe's salary.